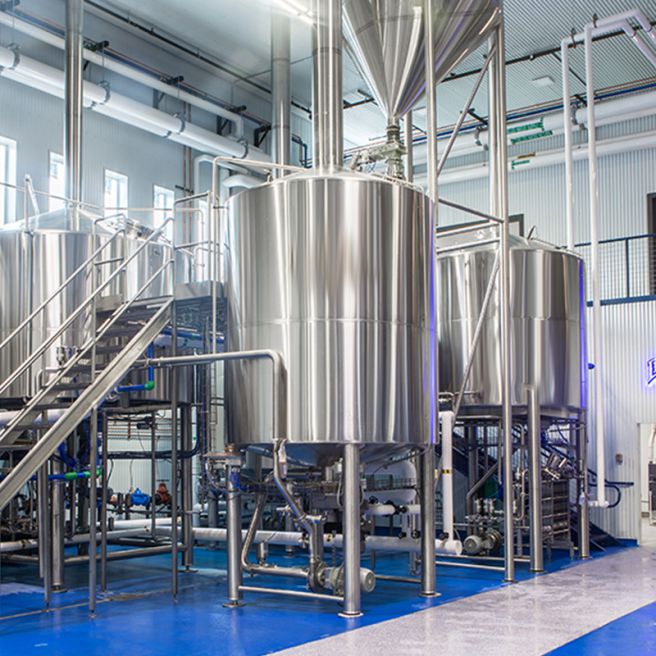
Brewhouse automation changes beer production by controlling temperature, flow, pressure, vessel level, pump speed, valve position, timing, and recipe steps through PLCs, sensors, and software. A 1°C mash-temperature difference can change enzyme activity, while small delays across several transfers can add hours to a production week. Automation reduces operator-dependent variation by repeating the same programmed sequence and recording actual process conditions. Brewers Association benchmarking from 2015 also shows how large utility differences can be between breweries: regional median water use ranged from 4.9 to 8.6 barrels of water per barrel of beer. Automation helps operators measure and reduce part of that gap.
A manual brewhouse depends on an operator opening valves, starting pumps, checking temperatures, adjusting steam, watching vessel levels, and recording readings at the correct time. A 20-barrel brewery completing three brews in one day may require dozens of individual equipment changes before wort reaches the fermenters. Automation moves repeatable steps into a PLC while leaving recipe changes, quality checks, maintenance, and unusual process conditions under brewer supervision.
Temperature control is one of the clearest examples. During mashing, enzymes respond to relatively narrow temperature ranges: beta-amylase is generally more active around the low-to-mid 60°C range, while alpha-amylase performs more strongly at higher mash temperatures. A recipe calling for a 64°C rest for 40 minutes can therefore produce different wort characteristics if one batch spends much of that period at 61°C and another reaches 67°C.
An automated system reads a temperature sensor every few seconds and adjusts steam, hot water, or an electric heating system according to its programmed control loop. Instead of an operator repeatedly turning heating on and off, the controller can reduce heat input as the mash approaches its setpoint, limiting overshoot.
Automation does not make raw materials identical; it makes the equipment respond to them in a more repeatable way.
Malt moisture, extract potential, grain size, water chemistry, and seasonal crop differences still affect the mash. The practical benefit is that brewers can separate raw-material differences from equipment-operation differences because temperatures, times, flows, and operator interventions are stored with the batch record.
That record becomes especially useful during lautering. Runoff that is too fast can compress the grain bed, while slow runoff reduces brewhouse capacity. Automated systems can compare vessel level, flow rate, pump speed, and differential pressure, then adjust a VFD-controlled pump or valve rather than maintaining one fixed setting throughout a 60- to 120-minute lauter.
The same logic applies to sparging. Water can be added according to measured flow and wort level instead of visual estimates. When extract, volume, or recipe limits are reached, the system can stop sparging automatically. The improvement is not a universal percentage because grist composition and equipment geometry differ, but the brewery receives comparable data for every batch rather than relying on notes such as “runoff looked slow.”
Measurement becomes more useful when the brewery compares several batches:
-
Mash temperature against target temperature at 1-minute intervals.
-
Actual versus programmed rest time.
-
Lauter flow in liters or barrels per minute.
-
Differential pressure across the grain bed.
-
Pre-boil volume and gravity.
-
Kettle evaporation over a 60- or 90-minute boil.
-
Knockout volume, temperature, and transfer time.
Those measurements connect automation with brewhouse efficiency. If 10 batches of the same beer show lower extract recovery after a mill adjustment, operators can compare crush settings, mash behavior, runoff time, and wort gravity rather than changing several variables at once.
Boiling also benefits from measured control. Steam valves can modulate as the kettle approaches boiling temperature, and recipe software can start boil timers only after defined conditions are reached. Hop additions scheduled at 60, 20, and 5 minutes can generate operator prompts or communicate with automatic dosing equipment.
Heat input matters because boiling is one of the large thermal demands in a brewery. The Brewers Association’s energy guidance notes that energy use per barrel varies strongly with brewery size and equipment configuration; smaller breweries often consume more energy per barrel because fixed energy requirements are spread across less production.
Automation gives operators the measurements needed to examine that consumption. Steam-valve position, heating duration, wort volume, pump operating time, and utility-meter readings can be associated with individual batches. A brewery can then compare a 90-minute boil with a revised 60-minute process only after confirming that wort quality, evaporation, bitterness, and other product requirements remain acceptable.
Water provides an equally useful production measure. Brewers Association 2015 regional benchmarking reported median water-use ratios of 4.9 bbl/bbl in the Northeast, 5.2 in the Pacific, 5.3 in the Mountain West, 6.9 in the Pacific Northwest, 7.8 in the North Central region, and 8.6 in the South. The dataset covered different brewery sizes and operating conditions, so the figures are benchmarks rather than universal targets.
A brewery without an effective conservation program may use more than 10 gallons of water for each gallon of beer, according to Brewers Association material. A large share does not become packaged beer; it is used for rinsing, vessel cleaning, floors, utilities, cooling operations, and other plant needs.
Automated filling and cleaning can control part of that usage. Flowmeters stop water at a defined volume instead of allowing a hose or vessel fill to continue until an operator notices it. Level sensors can prevent overfilling, while automated valve routing allows recovered water to be directed to another approved use where the brewery has been designed for recovery.
CIP offers a practical example. A manual cleaning cycle may depend on an operator deciding when a rinse looks complete. An automated system can measure conductivity, temperature, flow, and elapsed time, allowing rinsing to stop when a defined condition has been reached rather than after an arbitrary extra 5 or 10 minutes.
Brewers Association engineering guidance notes that moving from manual CIP to an automated unit capable of recycling rinse water can produce significant water and chemical savings. The actual percentage depends on tank size, pipe length, chemical recovery, rinse design, and how much water the original procedure used.
Production scheduling changes as well. Consider a four-vessel brewhouse with a mash mixer, lauter tun, kettle, and whirlpool. The next mash can begin while the previous batch occupies another vessel, provided transfer paths and downstream capacity are available.
A PLC can check whether the receiving vessel is empty, the correct valves are open, the pump is available, and the required level condition has been met before transfer begins. If a manual delay of only 10 minutes occurs on four transfers per day, 40 minutes of potential production time is lost. Over a 5-day brewing week, that becomes more than 3 hours.
For growing breweries, equipment selection therefore affects throughput as much as vessel volume. An appropriately specified craft beer equipment package can combine automated valves, pumps, VFDs, temperature transmitters, level measurement, PLC controls, and recipe management, but the number of vessels and automation level should match the intended brew schedule rather than simply maximize the number of automated functions.
A 10-barrel brewery producing one batch per day has different requirements from a 30-barrel operation targeting four or five turns. The larger schedule places more pressure on transfer timing, hot-liquor availability, wort cooling, CIP scheduling, and fermentation capacity. Automating the brewhouse without checking cellar capacity can simply move the waiting time downstream.
| Process area | Typical automated measurement | What operators can compare |
|---|---|---|
| Mashing | Temperature, time, water volume | Setpoint deviation across 10+ batches |
| Lautering | Flow, level, differential pressure | Runoff time and extract recovery |
| Boiling | Temperature, time, steam position | Energy use and evaporation |
| Whirlpool | Time, level, transfer status | Wort recovery and turnaround |
| Wort cooling | Inlet/outlet temperature, flow | Knockout stability and cooling demand |
| CIP | Conductivity, temperature, flow, time | Water, chemical use, cycle completion |
Data quality depends on the instruments behind the screen. A display showing 65.0°C is not useful if the temperature transmitter has drifted by 2°C. Flowmeters, conductivity probes, pressure transmitters, valve-position switches, and level sensors therefore need inspection and calibration according to the manufacturer’s service requirements.
Maintenance becomes broader after automation is installed. Breweries may need spare PLC input/output modules, actuator seals, proximity switches, power supplies, VFD components, and compatible sensors. Software and recipe backups also matter because replacing a failed HMI or controller without a current program can stop production even when every stainless-steel vessel remains mechanically sound.
Electrical energy deserves similar attention. Brewers Association benchmarking has shown large differences among breweries; 2015 regional medians included 25 kWh/bbl in the Mountain West, 26 kWh/bbl in the Northeast, 29 kWh/bbl in the Pacific, 34 kWh/bbl in the Pacific Northwest, and 68 kWh/bbl in the North Central region.
Automation cannot remove refrigeration or pumping demand, but VFDs can match motor speed to actual process requirements. A pump that does not need full flow during every step can operate below maximum speed, while automated shutdown logic prevents equipment from continuing to run after a transfer is complete.
Traceability also improves because the system can create one process history for each brew number. A record may contain recipe version, water additions, mash temperatures, rest durations, pump speeds, valve states, wort volumes, hop timings, alarms, operator acknowledgments, CIP status, and knockout conditions.
If a brewery produces 500 batches per year, manually reviewing handwritten records becomes difficult. Searchable digital records allow quality teams to compare one abnormal batch with the previous 20 batches of the same product and identify measurable differences in temperature, time, flow, or process interruptions.
A useful automation system records actual conditions, not only the recipe that was supposed to run.
Operator work changes rather than disappearing. Routine valve switching and timer watching decrease, while process supervision, calibration, recipe management, troubleshooting, and preventive maintenance become more important. Manual operating procedures are still needed because a failed sensor, stuck valve, network interruption, or damaged actuator can prevent an automatic sequence from continuing.
Safety interlocks can reduce some equipment-related exposure. A pump can be prevented from starting against a closed discharge path, and transfer logic can require confirmation that a receiving vessel has enough capacity. Automated chemical dosing can also reduce direct handling during CIP, although PPE, lockout/tagout, pressure protection, and chemical-safety procedures remain necessary.
The scale of the brewery determines how much automation is useful. A small operation brewing fewer than 1,000 barrels per year may accept more manual work in exchange for lower capital cost and recipe flexibility. A brewery operating above 10,000 or 100,000 barrels per year has more batches over which equipment cost can be spread, while repeatable timing and utility measurement become increasingly useful. Brewers Association benchmarking has long separated breweries into production ranges for this reason.
Before specifying controls, operators can document 20 to 30 existing brew cycles and measure where time, water, extract, or labor is being lost. If lautering varies by 35 minutes but kettle operation varies by only 3 minutes, lautering deserves closer engineering attention. If CIP consumes much more water than wort production, automated rinse control may provide more measurable improvement than adding another recipe screen.
The same review should cover the next 3 to 5 years of planned production. PLC input/output capacity, additional vessel connections, valve manifolds, network architecture, spare VFD capacity, and software licensing can be designed for later expansion. Adding spare connections during fabrication is generally easier than rebuilding a tightly packed process skid after production has increased.
Breweries should also define what happens when automation fails. Manual valve overrides, documented pump procedures, current electrical drawings, alarm histories, spare parts, PLC backups, and trained operators reduce recovery time. A system that saves 5% of normal production time offers little operational benefit if a single unsupported component can stop an entire brewing day.
Investment should therefore be compared with measurable production figures: batches per day, labor hours per brew, water in bbl/bbl, electricity in kWh/bbl, thermal energy per barrel, extract recovery, CIP duration, vessel turnaround, and rejected or reworked batches. Measuring the same figures for 30, 60, or 90 days after commissioning gives the brewery a practical way to see which parts of the automated process are actually performing differently.